The Other Side
As we await our turn (yes, take your turn!) for the vaccine and tread carefully through 2021 we could devote a bit of New Year thinking on where real estate fits in with our longer term plans.
The oft mentioned Canadian “obsession with ownership” is not without merit, whether house or condo. Neither is renting. Investing has a good track record. Let’s see what the data tells us.
First, the number of houses and condos sold the past 2 years, to compare year-over-year.
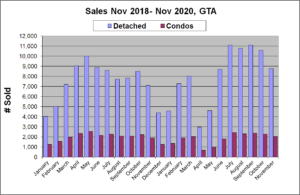
Note July to Nov 2020 vs. July to Nov 2019. Slightly more condos sold, a lot more detached houses sold. Now think, what does that do to the average price of properties sold?
Analogy: the cost of weekly groceries jumps before Easter, Thanksgiving, and Christmas. Does that mean food prices have jumped? No, it means that more carts include a big ticket turkey or ham.
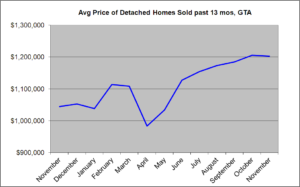
Same for housing. More detached homes in the sold mix boost average prices. That said, market values did rise for houses, as indicated in this 13-month Nov to Nov chart for GTA houses:
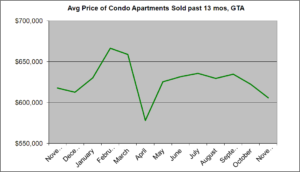
Condos did not fare as well:
However, before we celebrate with detached owners and commiserate with condo owners consider the price trend since January 2017:
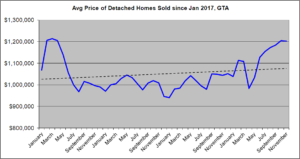
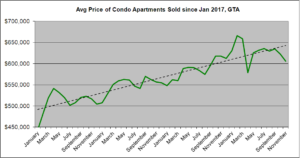
Note two things:
- the average price of detached homes is just getting back to January 2017 while that of condos is up a lot.
- the steepness of the two trend lines (10% rise constant: $500-550K for condos, $1mm-1.1mm for detached) shows that in price appreciation condos have substantially outperformed houses!
The lessons?
Detached owners, think long term. The trend remains your friend. Buyers, don’t get caught up in the headlines. Sellers, you could take advantage of the breakout .
Condo owners, you’re winning. This lull, too, shall pass. Buyers, don’t get caught up in the headlines, either. A rising tide lifts all boats, so everybody thinks they’re smart. But it’s never a good thing to overpay for your boat.
Renters, here’s the deep dive[1]:
On October 12, 2020 an article was published in the Globe and Mail titled: “Since 2003, Canadians would have been better off renting than buying”, written by Frederick Vettese, professional actuary and author. When you’ve gotten over the shock of that statement you’re ready for the data.
The cost of owning a home and holding it for 30 years was compared with the cost of renting and investing the savings in the stock market (using the broad index, not picking a basket of winning stocks). The analysis encompassed rolling 30-year periods starting 1938-1967 and ending 1990-2019.
- To reduce complexity and confusion the buyer at the start of each 30-year period buys to their max, set at 22% of earnings for mortgage payments and $80,000 downpayment in today’s dollars deflated back through time. To illustrate, the example given is a buyer in 1990 buying their property for $147,000 with a downpayment of $38,000.
- The renter invests the equivalent of the downpayment plus mortgage payments minus
- For 30 year periods up to 2001 owners’ net worth grew faster than renters’ because rents rose faster than mortgage payments.
- For periods ending 2002 and onwards renters net worth grew faster due to periods of high mortgage rates, such that for 30 year periods ending 2009 and onwards renters have gone well ahead in net worth.
I’m betting this sounds not just implausible but ridiculous for Toronto. The assumed big Toronto advantage, though, is not borne out by the data: the Canadian cities composite index rose 4.2% annually between 2001-2020, while Toronto’s index averaged 4.6%.
There are many data factors in the comparison. One of them is whether the ratio of annual rent to house prices stays below 5% (currently 4.5%). Above 5% buying wins. Both housing and stocks are at record highs with record-low interests rates. As rates rise both tend to moderate so the net worth comparison would continue to hold.
There are two pivotal factors for the renter: investing the savings and having housing stability. If they can achieve both they also accrue a further advantage: location flexibility. They can readily relocate for work and lifestyle, take advantage of opportunities, and experience more of what the world offers without the persistent strain of high housing costs and the long grind to cashing out at retirement. Not for everyone but available to some.
There are two pivotal factors for the owner: the forced savings underneath high housing costs and pride of ownership. For most these are the worn and proven paths to financial security, and the justification for the oft mentioned Canadian obsession with owning.
I bring you back to the Jan 2017-Nov 2020 house chart. The May-Nov 2020 upward break through the trendline is being touted as ‘better get in now’. Follow the break and your property value would double in 5 years. So you’re more realistic and think – okay, 10 years.
I’ve been seeing million dollar homes the past few months and I cannot fathom that in 10 years the next set of buyers will pay $2 million for them. I say current buyers should not count on that in their lifetime. Gravity rules in economics as it does in physics. Incomes simply cannot keep up with rising prices and the distortions of foreign money has limits. British Columbia is leading the way with the new Land Owner Transparency Registry, their latest action of several the past few years to push against “… the resulting exclusion of local income earners from home ownership”.
All that said the flurry of forecasts from industry spokespersons is for the 2020 trend to continue in 2021. So it might, until it doesn’t.
[1] Be aware of the recurring dishonesty in many owning vs. renting stories where mortgage payments are compared to monthly rent. Who’s paying the property taxes, the home insurance, the owner’s condo maintenance? Who’s paying to replace the roof in 10 years, the windows in 15, the central air unit, the furnace, the refrigerator … and other requirements that fall to owners and not renters?
The Mid-Pandemic Situation
I say mid-pandemic because the reopening of economies across the world is proceeding, albeit unevenly, the stock market is assuming the best for economic recovery and an early vaccine (assuming people will line up for it), empty-stadium professional sports is returning, and people are venturing out increasingly. However, like anything that is midway through the endgame is far from certain.
Forecasts
As for real estate we can start with CMHC’s Housing Market Outlook around the end of May. Their forecast for sold properties nationally was for the average MLS® price to “decline by 9% to 18% from pre-COVID-19 levels before beginning to recover in the first half of 2021”, and price levels could “return to their pre-COVID-19 levels by the end of 2022.
Then we can consider Globe & Mail Rob Carrick’s “Five numbers …”: https://www.theglobeandmail.com/investing/personal-finance/article-do-you-have-high-hopes-for-the-housing-market-these-five-stats-will/
- $1.77 of debt per $1 of after-tax household income
- 734,000 borrowers who deferred mortgage payments in June
- 67% of households surveyed by TransUnion (credit agency, like Equifax) are concerned about their ability to pay bills and loans.
- 5.86 million Canadians 18-70 yrs old, or 22.7% of the total in that age range, assessed as being “financially resilient”. Subtracting the in-betweens left 50% being financially vulnerable or extremely vulnerable.
- 42.1% of 20- to 24-year-olds returning to school were unemployed in May, vs. 10.8% in May 2019.
A prediction that’s out there: Just wait. The housing market won’t be what it used to be for years.
The data
It’s still early days and governments are printing money like crazy. The long-term effects on the economy and the governed are in doubt, but the short-term effects on real estate show a rebound.
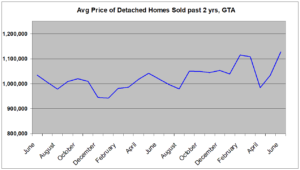
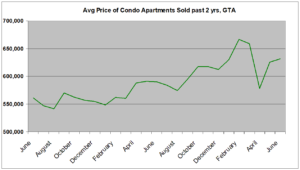
What’s happening
One fundamental explanation for the rebound: 3 months worth of buyers crowded into 1 month when there were 29% fewer listings vs. June last year. Most owners can wait while many buyers have sold or have given notice. Add to that FOMO – the Fear Of Missing Out, which the industry is masterful at stimulating – plus super-low interest rates and … boom.
Keep in mind that average sold prices can be skewed simply by the proportion of high-priced vs. low-priced properties among those sold (imagine the average prices of cars sold if European makers have a great month).
To try to reduce the skew I looked at similar property types in bounded areas. I had to use large search areas to collect enough sales, especially with very low sales in April and May. In doing so each search area included a diversity of neighbourhoods. Nonetheless the data should better reflect actual market value trends than GTA-wide averages. And as you can see, the trend is up.
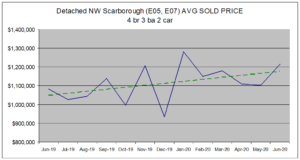
But what’s the endgame? Up, up, and away? That what a lot of investors are assuming about the stock market while some serious people have serious doubts.
Here’s the trendline for buyers of detached houses who succumbed to FOMO in Q1 2017.
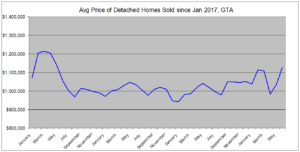
Over 3 years later they’re still underwater with their big downpayments and even bigger mortgages. The present gust of wind at their back might reverse in the next little while. Those who come out on top in current bidding wars might not feel like winners down the road.
Still, there are opportunities. At the macro level condos have been outperforming detached homes (see my January blog post below). Within trends across property types specific situations will favour the seller, and specific situations will favour the buyer. My best advice: work with a realtor who is less a cheerleader motivating you and more an advisor encouraging mindfulness.
